This article explores the majority
dataset and its potential uses.
Majority
The majority dataset contains the winning candidate and
the margin of victory by electorate. The majority is calculated by
subtracting the number of votes of the winning candidate form the number
of votes of the second candidate. The margin of victory divides this
number by the total votes cast to create a percentage figure.
Upload data
View the shape of data frame.
| Election | Electorate | Party | Candidate | Votes | Percentage | Party_List |
|---|---|---|---|---|---|---|
| 2023 | Auckland Central | Green Party | SWARBRICK, Chloe Charlotte | 3896 | 11.31 | Yes |
| 2023 | Banks Peninsula | National Party | WEENINK, Vanessa | 396 | 0.81 | Yes |
| 2023 | Bay of Plenty | National Party | RUTHERFORD, Tom | 15405 | 34.57 | Yes |
| 2023 | Botany | National Party | LUXON, Christopher | 16323 | 44.69 | Yes |
| 2023 | Christchurch Central | Labour Party | WEBB, Duncan | 1841 | 4.75 | Yes |
| 2023 | Christchurch East | Labour Party | DAVIDSON, Reuben John | 2397 | 6.25 | Yes |
Update electorate names
Update of the names of electorates so that they can be traced back through name changes.
# Convert pre-2020 electorate names to match name changes that occurred in 2020 and view
df <- update_names(df, output = "electorate")
head(df)| Election | Electorate | Party | Candidate | Votes | Percentage | Party_List |
|---|---|---|---|---|---|---|
| 2023 | Auckland Central | Green Party | SWARBRICK, Chloe Charlotte | 3896 | 11.31 | Yes |
| 2023 | Banks Peninsula | National Party | WEENINK, Vanessa | 396 | 0.81 | Yes |
| 2023 | Bay of Plenty | National Party | RUTHERFORD, Tom | 15405 | 34.57 | Yes |
| 2023 | Botany | National Party | LUXON, Christopher | 16323 | 44.69 | Yes |
| 2023 | Christchurch Central | Labour Party | WEBB, Duncan | 1841 | 4.75 | Yes |
| 2023 | Christchurch East | Labour Party | DAVIDSON, Reuben John | 2397 | 6.25 | Yes |
Add type of electorate
Add a column of the electorate type to filter out Maori electorates.
# Add Electorate Type and filter for General electorates only and view
df <- add_data(df, output="type")
head(df)| Electorate | Election | Party | Candidate | Votes | Percentage | Party_List | Electorate_Type |
|---|---|---|---|---|---|---|---|
| Auckland Central | 2023 | Green Party | SWARBRICK, Chloe Charlotte | 3896 | 11.31 | Yes | General |
| Auckland Central | 1999 | Labour Party | TIZARD, Judith Ngaire | 5285 | 16.19 | yes | General |
| Auckland Central | 2005 | Labour Party | TIZARD, Judith Ngaire | 3884 | 10.79 | Yes | General |
| Auckland Central | 2011 | National Party | KAYE, Nicola Laura | 717 | 2.16 | Yes | General |
| Auckland Central | 2020 | Green Party | SWARBRICK, Chloe Charlotte | 1068 | 3.00 | Yes | General |
| Auckland Central | 1996 | Labour Party | TIZARD, Judith Ngaire | 3353 | 10.03 | Yes | General |
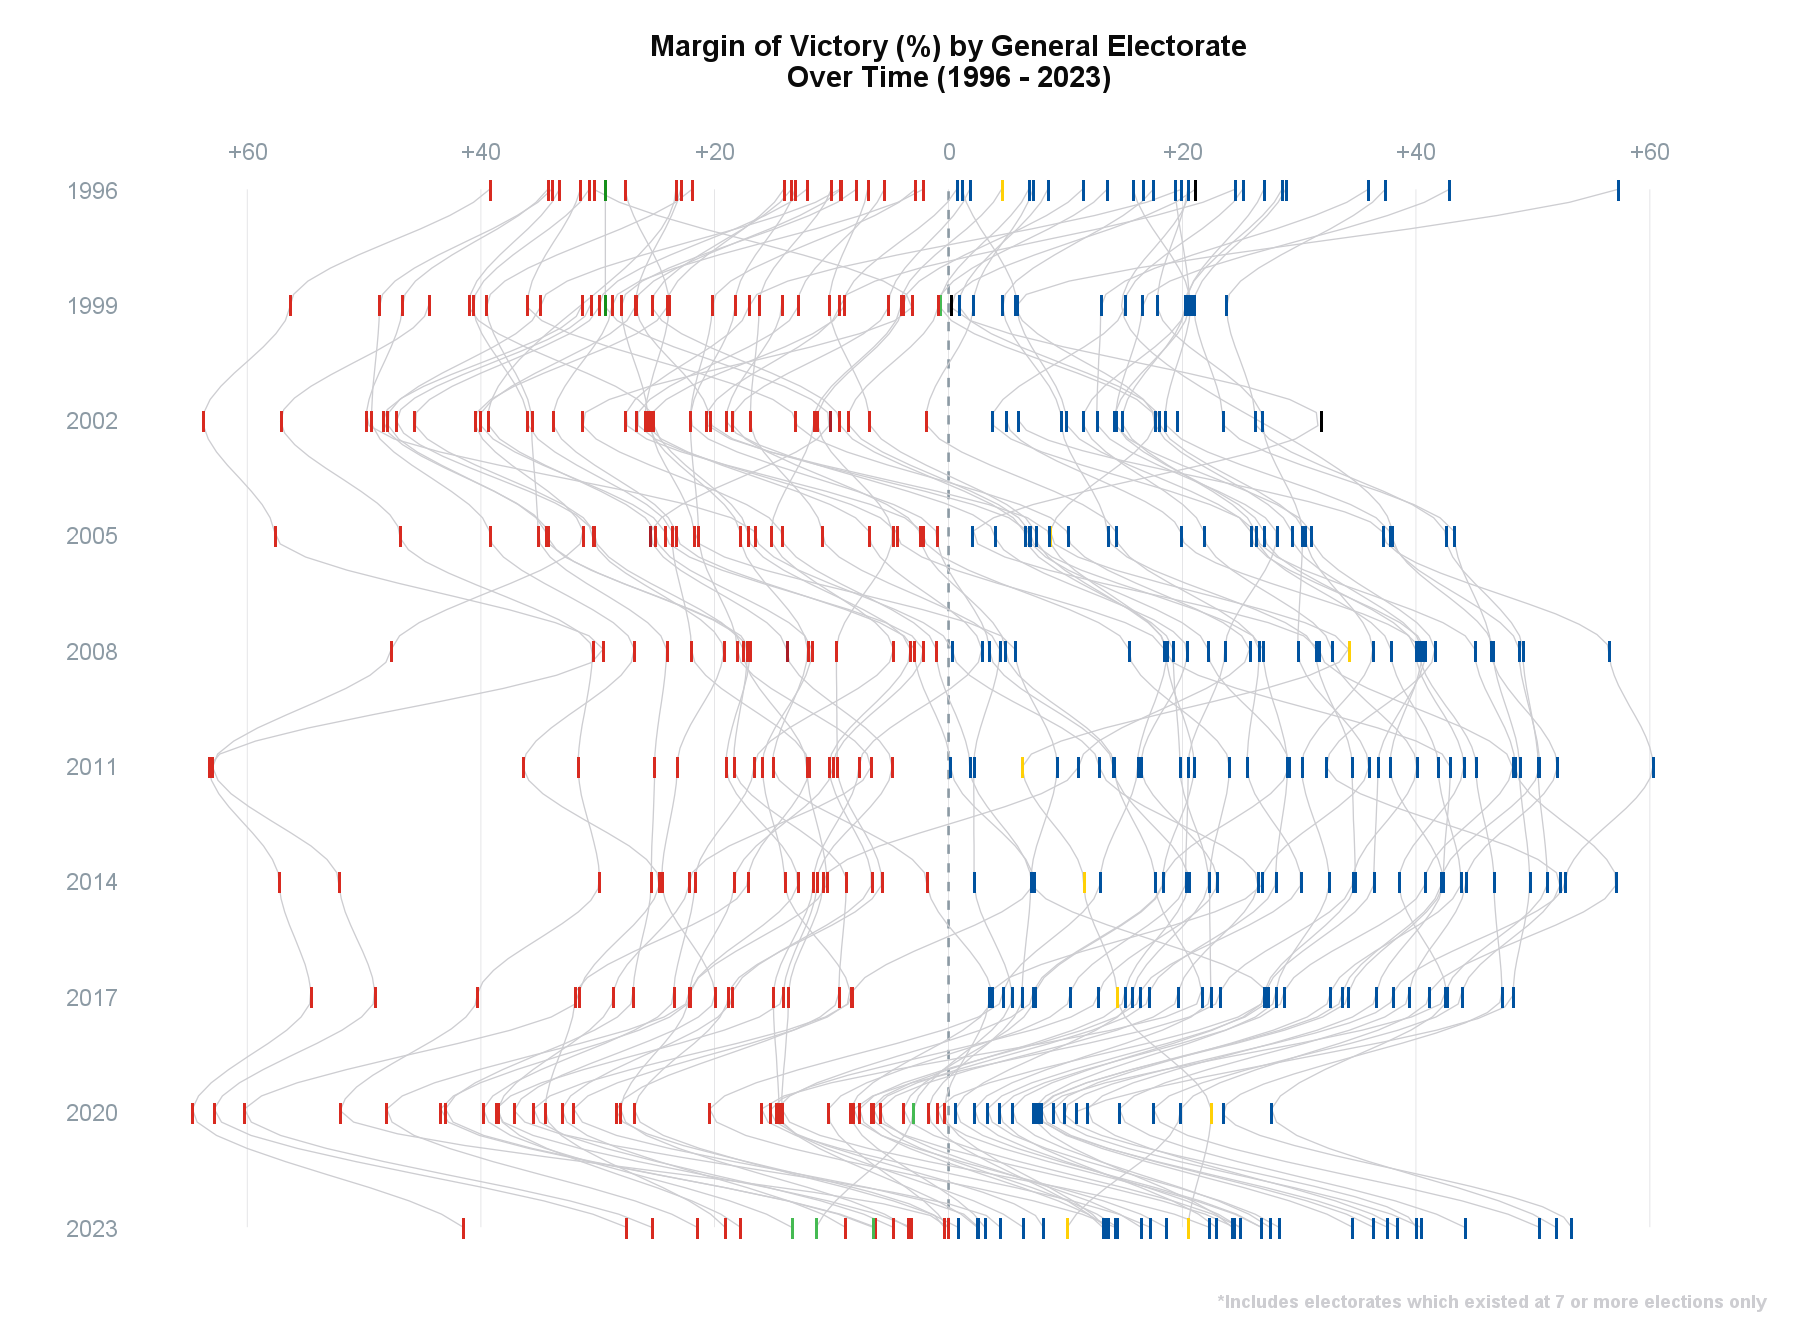
Plot
Create a parallel coordinates plot to track and visualise how electorates have changed hands and their margins increase or decrease across all MMP elections.
df %>%
  filter(Electorate_Type == "General") %>%
  # Remove electorates that had fewer than 7 elections
  group_by(Electorate) %>%
  mutate(No. = length(Electorate)) %>%
  ungroup() %>%
  filter(No. >= 7) %>%
  mutate(Percentage = ifelse(Party %in% c("Labour Party", "Green Party",
                                          "Alliance", "Jim Anderton's Progressive"),
                             -Percentage, Percentage)) %>%
  ggplot(aes(y=Percentage, x=reorder(Election, -Election), group=Electorate, colour=Party)) +
  geom_hline(yintercept = 0, colour = scgUtils::colour_pal("Regent Grey"),
             linewidth = 0.5, linetype = "dashed") +
  geom_smooth(method = "loess",formula = 'y ~ x',
              colour = scgUtils::colour_pal("French Grey"),
              span = 0.3, se = FALSE, alpha = 0.25, linewidth = 0.25) +
  geom_point(shape='\u6c', size=4) +
  scale_y_continuous(limits = c(-70,70), expand = c(0,0), position = "right",
                     breaks = c(-60,-40,-20,0,20,40,60),
                     labels = c("+60","+40","+20","0","+20","+40","+60")
  ) +
  scale_x_discrete(expand=c(0,0)) +
  scale_colour_manual(values = scgUtils::colour_pal("polNZ")) +
  labs(title = "Margin of Victory (%) by General Electorate\nOver Time (1996 - 2023)",
       caption = "\n\n*Includes electorates which existed at 7 or more elections only",
       y = "",
       x = "") +
  coord_flip(clip = "off") +
  scgUtils::theme_scg() %+replace%
  theme(legend.position = "none",
        panel.grid.major.y = element_blank(),
        panel.grid.minor = element_blank(),
        axis.line = element_blank(),
        axis.ticks = element_blank(),
        axis.text.x.top = element_text(vjust = 4)
  )